
Added Sugar vs. Naturally Occurring Sugar: Is Your Body Treating Them Differently?

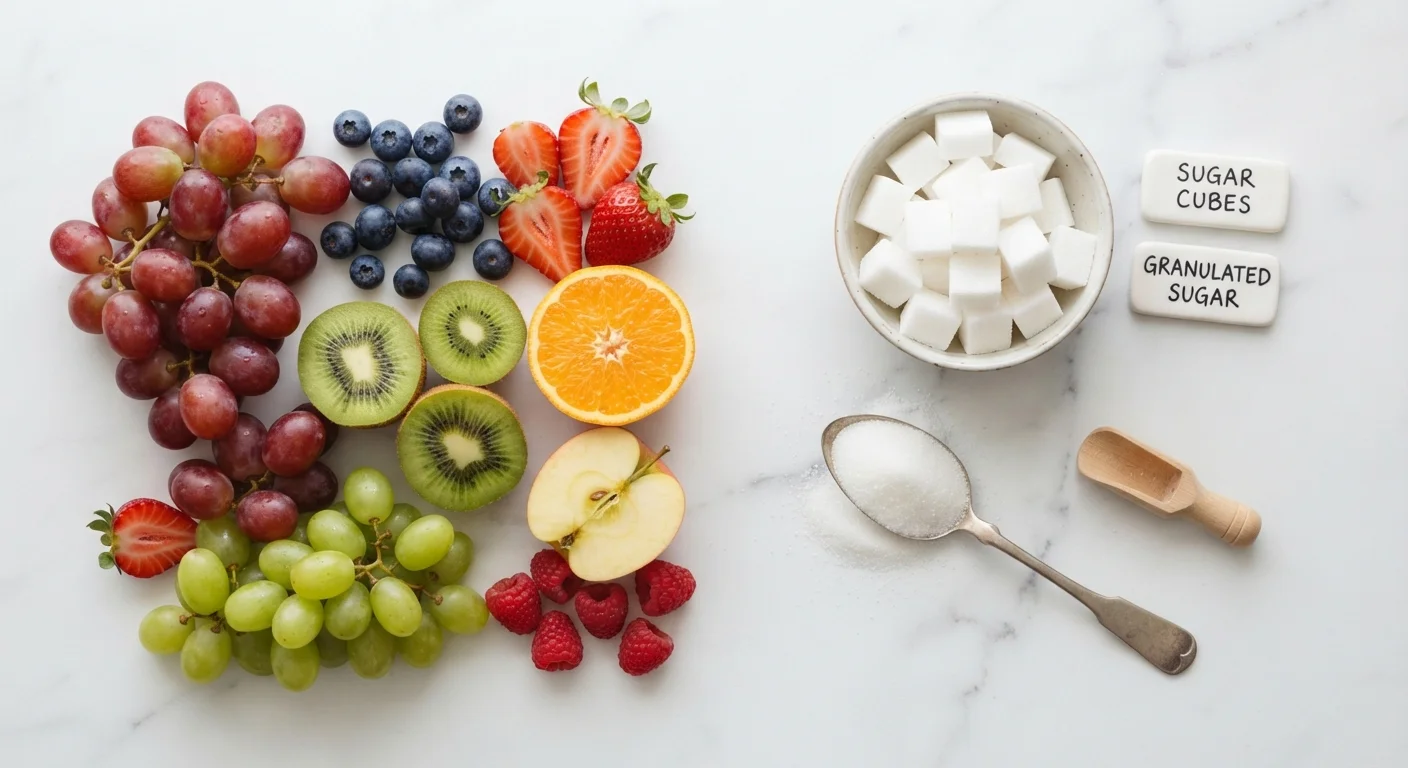
Photo: DockedReads.com | Information Made Easy editorial
Key Takeaways
- Chemically, fructose in fruit and fructose in soda are identical molecules — context is what differs.
- Naturally occurring sugars arrive with fiber, water, and nutrients that slow absorption and support satiety.
- Added sugars provide calories without beneficial nutrients, and high intake is linked to metabolic concerns.
- The Dietary Guidelines for Americans recommend limiting added sugar to less than 10% of daily calories.
- Whole food sources of sugar rarely contribute to overconsumption in the way processed sources do.
- Always consult a qualified healthcare professional or registered dietitian for personalized dietary guidance.
The Chemistry Is the Same — So Why Does the Source Matter?
At the molecular level, sucrose is sucrose and fructose is fructose, regardless of whether it comes from a mango or a soda. Your digestive system breaks both down identically. So why do nutrition researchers and public health guidelines treat them so differently?
The answer lies in the nutritional matrix — the surrounding package of fiber, water, vitamins, and minerals that comes with food in its whole form. When you eat an apple, its roughly 19 grams of naturally occurring sugar arrive bound to about 4.4 grams of fiber and a meaningful amount of water. That combination slows digestion, moderates the blood-glucose response, and contributes to feelings of fullness. When you drink a sweetened beverage, you consume a concentrated dose of sugar with little to none of that buffering structure. The molecule is the same; the physiological experience is not.
This distinction is central to understanding what the research actually says — and what it doesn't. See our exploration of whole versus processed foods for a deeper look at why food structure shapes nutrition outcomes.
How Each Type Affects the Body
Naturally occurring sugars in fruit, vegetables, and unsweetened dairy tend to be consumed alongside compounds that moderate their impact. The fiber in whole fruit, for instance, slows gastric emptying and blunts postprandial glucose spikes compared to juice with the same sugar content. Dairy sugars (primarily lactose) are digested more slowly than sucrose and come paired with protein and calcium.
Added sugars — cane sugar, high-fructose corn syrup, honey, agave, and other caloric sweeteners added during processing or preparation — contribute energy without meaningful accompanying nutrients. Research published in major journals including JAMA Internal Medicine and Circulation has associated high added-sugar intake with elevated risk of cardiovascular disease, type 2 diabetes, and obesity. These associations are strongest at high consumption levels and do not imply that moderate intake causes disease in otherwise healthy individuals.
17 tsp
Average daily added sugar intake in U.S. adults
According to CDC data, American adults consume an average of about 17 teaspoons of added sugar daily — well above recommended limits.
< 10%
Recommended added sugar limit (daily calories)
The Dietary Guidelines for Americans advise keeping added sugar below 10% of total daily caloric intake for healthy adults.
39%
Added sugar calories from sweetened beverages
CDC analysis indicates beverages — including sodas, energy drinks, and sweetened coffees — account for nearly 39% of all added sugar consumed by U.S. adults.
Importantly, studies that show adverse effects of fructose often use doses far exceeding typical dietary exposure from whole fruit. Epidemiological evidence consistently shows that fruit consumption is associated with positive, not negative, health outcomes — underlining that context, not just chemistry, determines health impact.
Reading the Labels and Understanding Your Intake
Since 2020, U.S. Nutrition Facts labels are required to list Added Sugars as a separate line item beneath Total Sugars. This gives consumers a direct tool: if a yogurt shows 12 g total sugars with 0 g added sugars, that sweetness is coming from lactose — a naturally occurring source. If a flavored yogurt shows 20 g total sugars with 12 g added sugars, more than half the sweetness was introduced during manufacturing.
| Criterion | Naturally Occurring Sugar | Added Sugar |
|---|---|---|
| Primary sources | Fruit, vegetables, dairy | Processed foods, sweetened beverages |
| Nutritional context | Fiber, vitamins, minerals, water | Little to no additional nutrients |
| Absorption rate | Slower (buffered by fiber/protein) | Faster (less structural buffering) |
| Dietary guideline limits | No specific upper limit (whole foods) | < 10% of daily calories (US guidelines) |
| Label identification | Included in Total Sugars only | Listed separately as Added Sugars |
| Association with metabolic risk | Low at typical dietary levels | Higher at elevated intake levels |
The Dietary Guidelines for Americans recommend limiting added sugars to fewer than 10% of total daily calories — approximately 50 grams for a 2,000-calorie diet. The American Heart Association sets even stricter guidance: no more than 25 grams per day for women and 36 grams for men. By contrast, no comparable upper limit applies to naturally occurring sugars from whole-food sources in the context of an otherwise balanced diet.
A Note on 'Natural' Sweeteners
This article is for general informational and educational purposes only and does not constitute medical or dietary advice. Consult a registered dietitian or qualified healthcare professional before making significant changes to your diet.
The content on this site is for informational purposes only and is not a substitute for professional advice. Always consult a qualified professional for guidance specific to your situation.